Table of Content
Well, you’ve created visually appealing content, developed a business strategy, and even prepared a content plan. What’s next?
Key Metrics
All that is left to do is to understand how to control the dynamics of account growth and which metrics to focus on. Let’s look at the most important metrics you need to track.
For fast and high-quality promotion, you have to know who your audience is, which posts they like and which don’t. To find out all the necessary information, switch your personal account to a business account. You can do it in Instagram account settings.
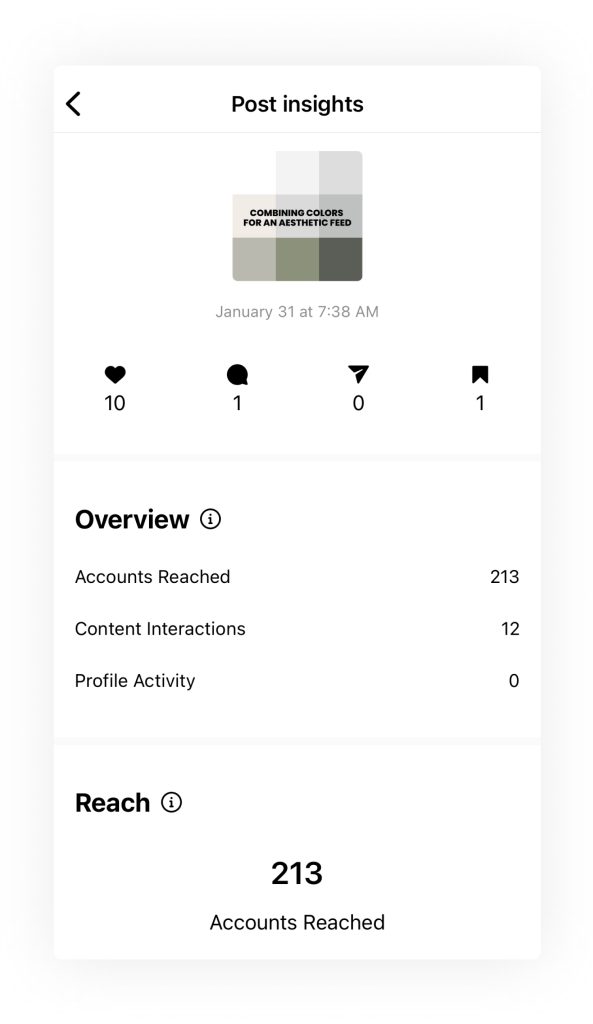
To view post metrics, tap a post you’d like to check and then tap View Insights below the image.

Stories analytics are located next to Stories views.
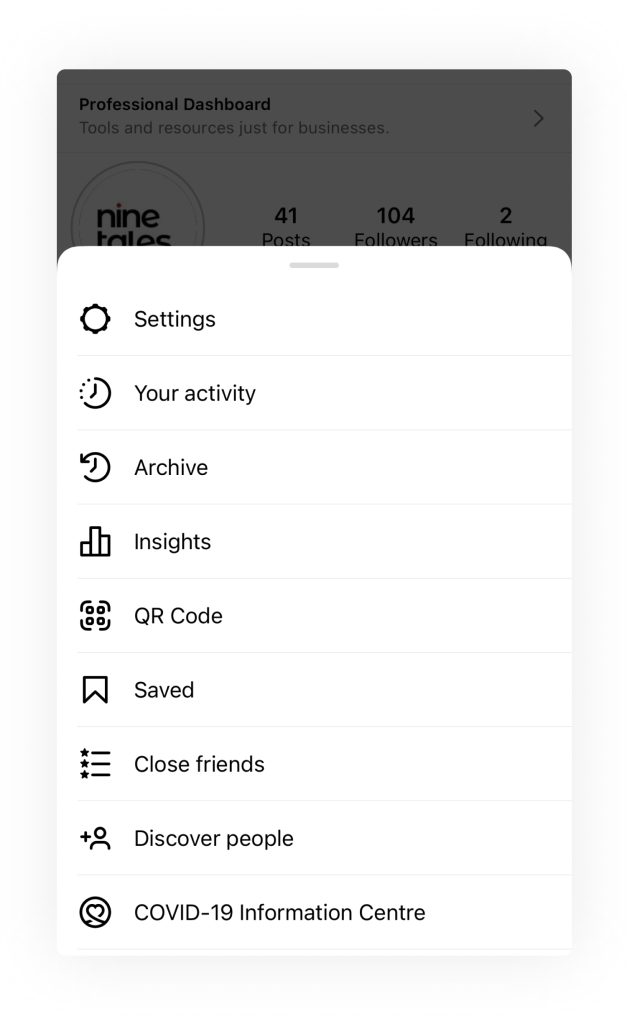
General Insights can be found in the top right corner of your Instagram profile, by tapping the “Insights” button.
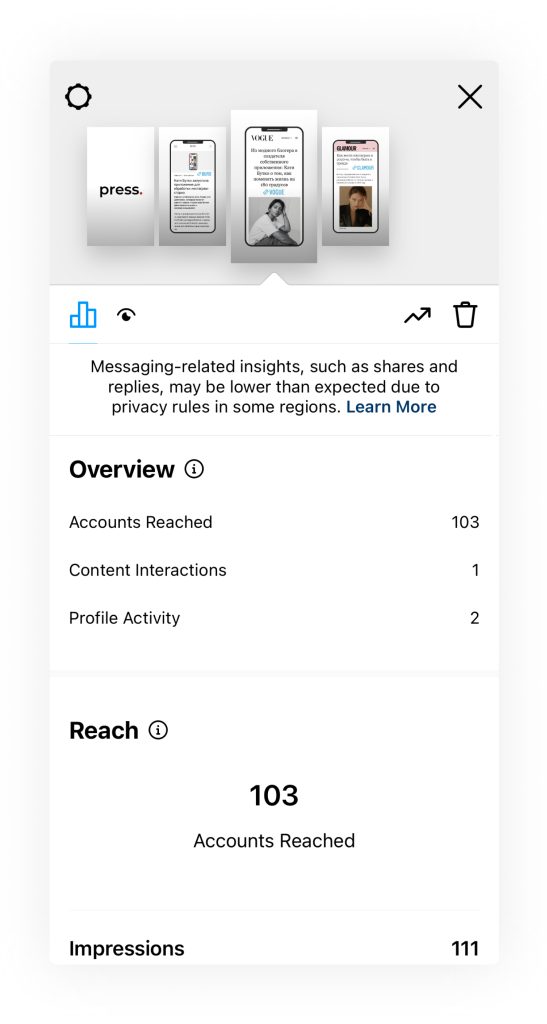
Reach
Reach is the total number of unique users who have seen your post. This metric vastly differs from impressions that are not unique to one user. Reach is the measure of how many people have seen your content once.
Pay attention to this metric as it allows you to understand what percentage of your followers end up seeing your post. Don’t worry if you find the number different from 100%. In fact, not all followers read your publications, and it’s natural for Instagram. 40-60% is a good reach percentage. It’s worth mentioning that the more followers you have, the less reach you’ll have. And this is normal.
How to increase your reach?
– Post something people want to interact with: like, comment, or share on Stories. It’s important to engage followers immediately – then your post will appear in other users’ feeds.
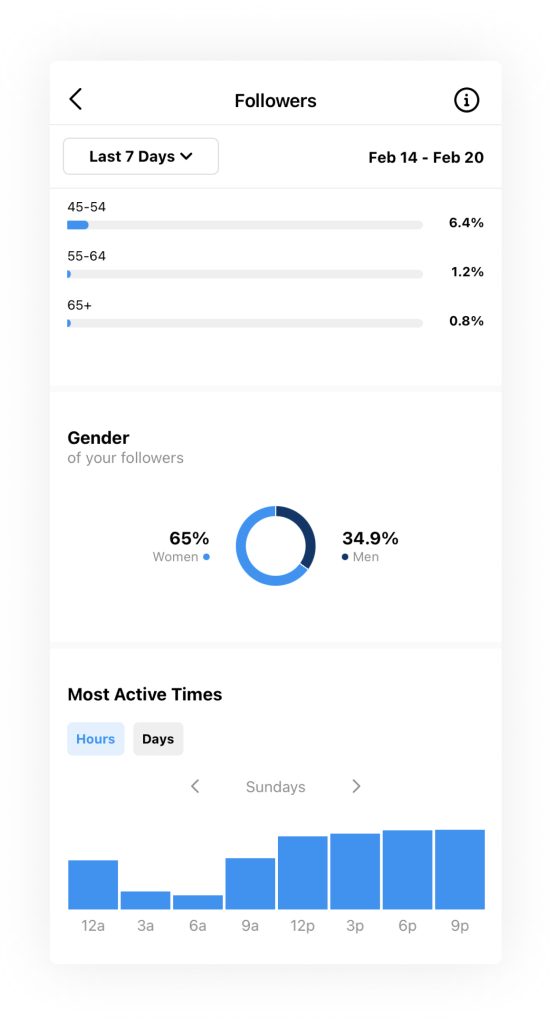
– Make publications when your audience is the most active. By the way, there is such a metric, too. You can find right under the follower demographics in Instagram analytics. Of course, there are general trends of most active times, but it still depends on the type of profile.
– Connect through Direct Messaging with people who interact with posts. The more communication there is, the more often followers will see your posts.
– Use hashtags and add a location. Yes, hashtags still work and drive traffic. For Instagram algorithms, it doesn’t matter where you place hashtags: in the caption or comments. But the latter choice saves important space for words. As for Instagram location, it allows users to find your profile.
Create interesting posts – it’s a key to success. Users will interact with your publications and promote them. So, design is also important: people like and repost aesthetically pleasing pictures more often. Use our templates to create visually appealing posts!

Engagement Rate
Engagement rate is a metric used to assess the average number of interactions your social media content receives per follower. You can calculate it as the total number of interactions your content receives divided by your total number of followers, multiplied by 100%.
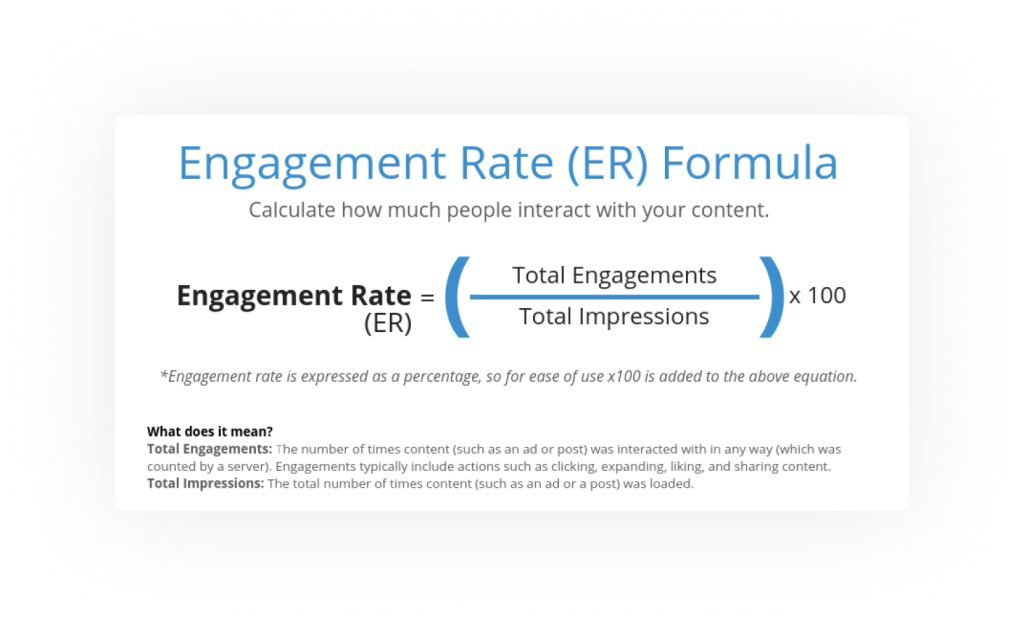
For example, if you have 200 followers and receive 100 likes and 20 comments, this means that your total engagement will be 120/2000 * 100 = 6%.
The engagement rate on Instagram between 5% and 10% is generally good. You need this tool to understand what your followers prefer more. The more reactions a post has, the more Instagram promotes it. That’s why this metric is essential.
ERR (Engagement Rate by Reach) informs about the percentage of users who engaged with a post given its reach. It’s calculated as the total engagement (likes and comments) divided by reach per post. This metric counts both the amount of Reach that your post received and the number of people who saw your post. It’s useful if you want to see a complete and accurate picture of your profile statistics.
Saves and shares
They show whether your post is saved and shared. If yes, then everything’s fine – users like your post and interact with it. It’s a sign that you are moving in the right direction, and it’s worth considering creating more similar posts.
People tend to save and share useful information, emotional posts, or personal insights. And, of course, posts with cute dogs and cats are also popular.
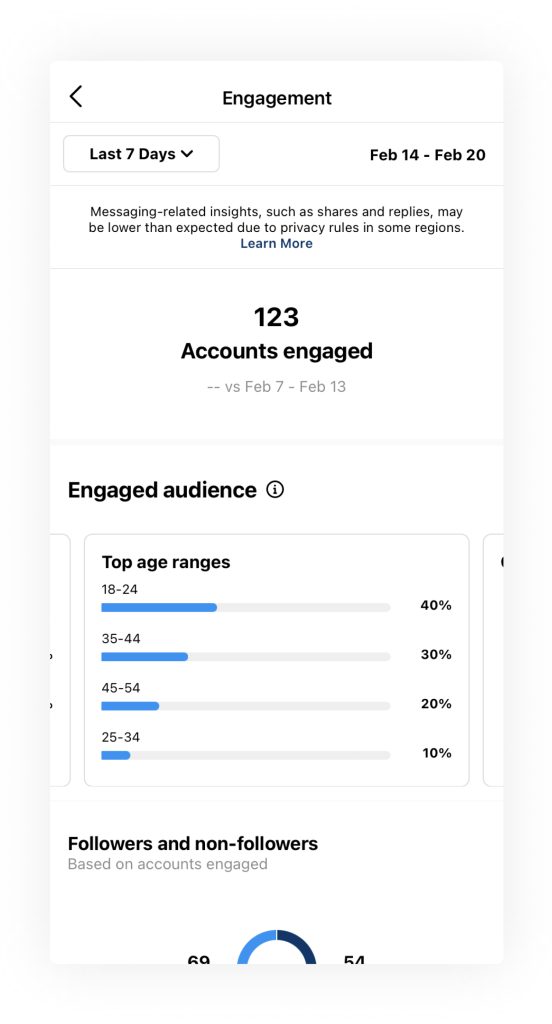
Audience insights
This is a whole set of metrics that show which audience follows you. You can find out such demographic information about your reached audience as gender, age, location, and most active times. It helps you understand whether those for whom you create content truly like it. If you’re not satisfied with the insights, it’s an opportunity for you to do research and decide how to promote your account to attract users.
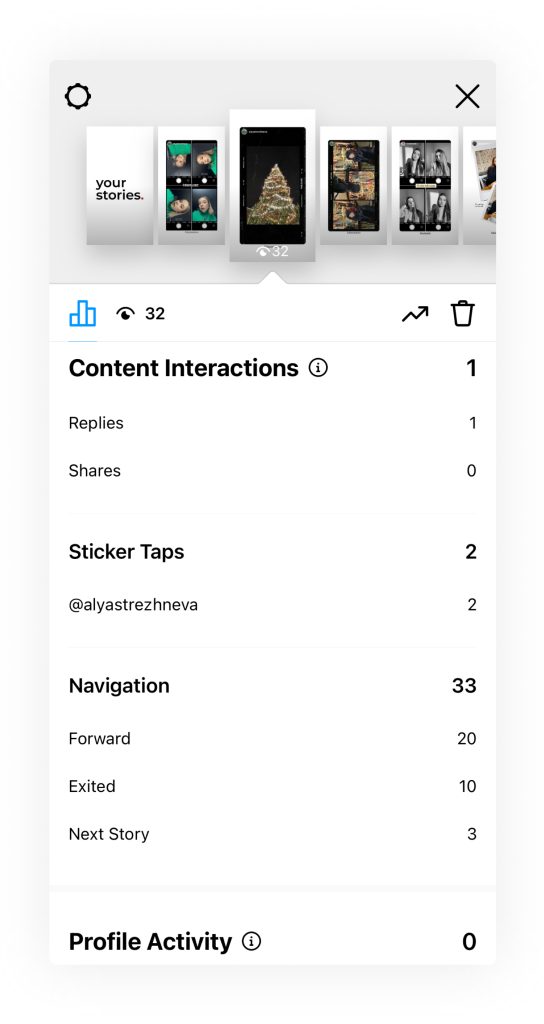
Stories metrics
As well as posts you can monitor Stories statistics. Metrics there are very similar to those in the posts. For example, views are your reach, interactions are your shares. Another metric worth mentioning here is the Sticker Taps, which shows the number of times people have tapped on a location tag, mention, or product sticker on your Story. Also, Stories have Navigation metrics: taps forward, taps back, swipes away, and exits. All these things help you understand how users interact with your Story, whether they keep their attention on it or move on to the next one.
Link Clicks
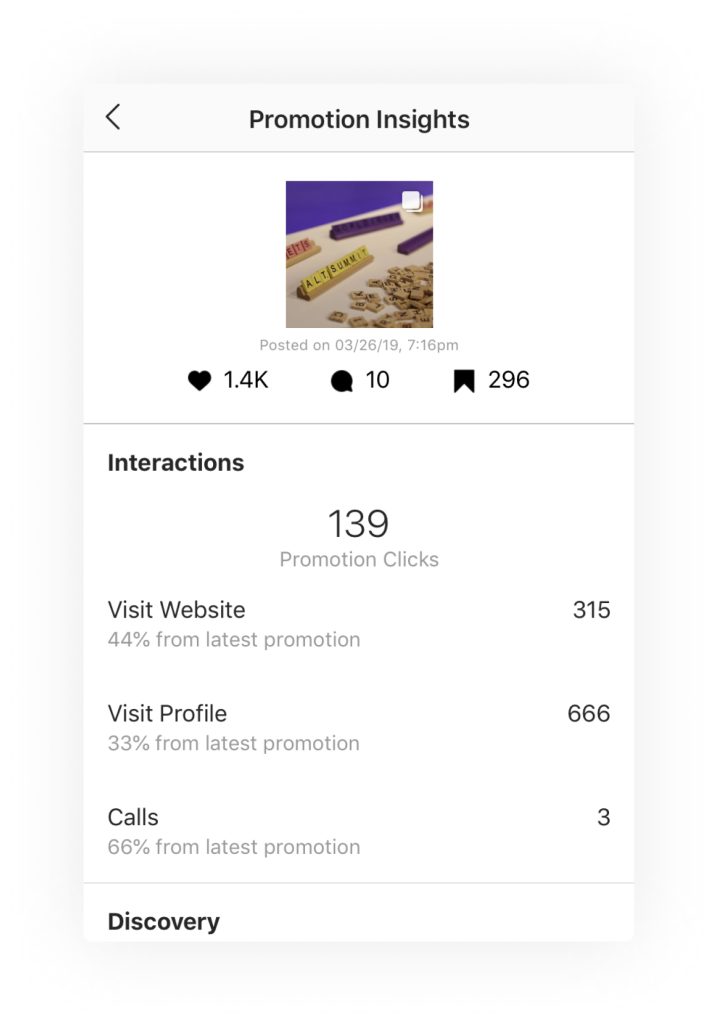
There is analytics for promoted posts. If posts don’t encourage users to make purchases, then even high reach and engagement won’t help. Promotion insights allow you to learn the number of link clicks and profile visits. Instagram will also show the percentage of people who came both from your promotion and your post.
Metrics give you information on whether you’re moving in the right direction or you need to change something in your promotion strategy. Track metrics regularly and, if necessary, adjust your content plan for better promotion!